Global stock markets are off to a strong start in 2021 as the world begins to emerge from the shadow of the COVID-19 pandemic. In the United States, vaccinations are increasing, the economy is expanding, unemployment is falling, and stimulus continues to flow through the economy. With the consensus crowding into an optimistic corner, many investors are wondering if sentiment may be running too hot.
Getting Better, Not Worse
Against a backdrop of historic fiscal and monetary stimulus, the global economy is emerging from the pandemic. With vaccination rates increasing—nearly 50% of the adult population in the U.S. have received at least one shot—and looser restrictions on activity, it is certainly understandable for investors to expect a rosy environment for stocks. The World Health Organization (WHO) declared COVID-19 a global pandemic a little over a year ago, and now a mere 15% of respondents to the recent Bank of America Global Fund Manager Survey view it as the largest tail risk. With the path forward ostensibly skewed to the upside, sentiment has become increasingly optimistic.
Sentiment A Near-Term Risk
The S&P 500 has rallied nearly 90% since its low on March 23, 2020, and is already up 10% in 2021 without so much as a 5% pullback on a closing basis. “Nothing changes sentiment like price” is an old saying, and 23 new all-time highs in 2021 (the most this early in any year since 1998) have made investors quite optimistic; however, excessive optimism can open the door for contrarian sellers to weigh on prices. When we upgraded our view on equities to overweight in late March 2020, one of the main reasons was the overriding sentiment backdrop of extreme pessimism that we felt limited the opportunity for further selling.
This time around, many of our favorite sentiment gauges are becoming extremely bullish, which could be a near-term contrarian warning.
- The American Association of Individual Investors Sentiment Survey recently showed bulls outnumber bears by the most since January 2018.
- The 10- and 20-day average put/call ratios from the Chicago Board Options Exchange (CBOE) are above their 95th percentile—suggesting option markets are flashing a good deal of complacency. (Put options offer downside protection and express a negative view, while calls express a positive view by offering the right to buy.)
- The Bank of America Global Fund Manager survey also showed that portfolio managers are maintaining significant underweights to cash, implying investors are all-in on the “risk on” environment.
Participation is Incredibly Strong
Sentiment isn’t the only warning sign we see near-term. The S&P 500’s 10% run from early March has the index at all-time highs, but has also pushed it to its most overbought status since early September, based on its 14-Day Relative Strength Index (RSI), a widely-used momentum measure. We believe the short-term, overbought conditions that we are experiencing now are a bullish indicator over the intermediate-term, as they show investor enthusiasm for equities. But in the near-term they can lead to more volatility, like we saw in September when the S&P 500 fell 9.9% before rallying nearly 12% in the fourth quarter.
Another reason to be optimistic over the course of 2021 is that internals of the market are as strong as they have ever been. In fact, more than 95% of components in the S&P 500 Index are above their 200-day moving averages, a reading seen only two other times in the past 30 years [Figure 1]. Perhaps most importantly, those two other times were late 2003 and late 2009, near the beginning of major bull market runs—not the end.
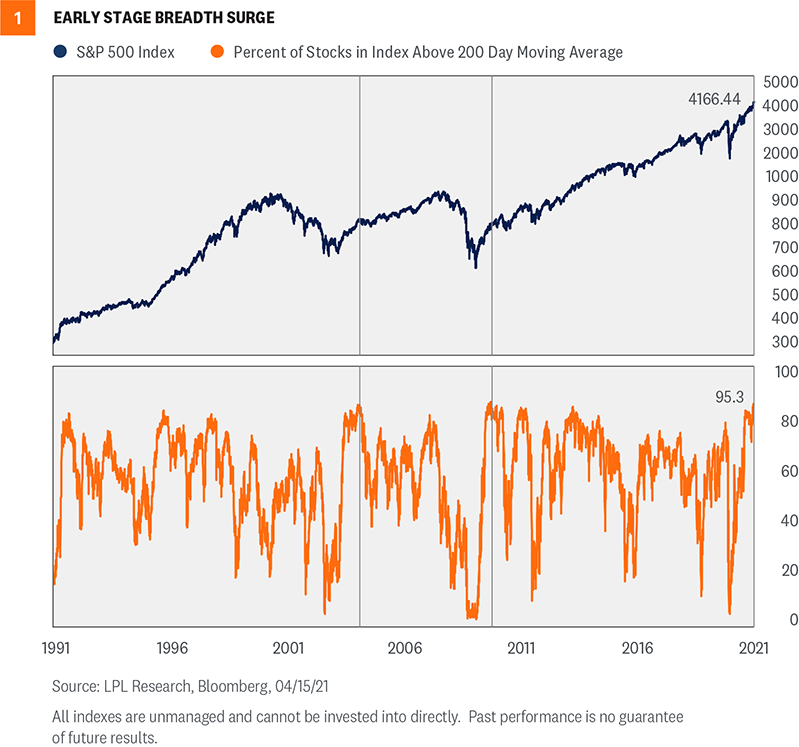
Overall, it would not surprise us to see some volatility over the coming months as markets digest these strong momentum surges. The previous two instances when we saw 95% of the components in the S&P 500 above their 200-day moving average in 2004 and 2010 opened the door to periods of consolidation and choppiness. In fact, 2010 saw as much as a 16% correction in the middle of the year before moving back to new highs before the end of the year. We’ve noted in the past that bull markets tend to catch their breath in year two, and we wouldn’t be surprised if we see a similar theme this year. However, as we enter the worst six-month period of the year, “Sell in May and go away,” we suggest using pullbacks opportunistically, and considering adding equities depending on objectives and risk tolerance.
Conclusion
We’ve come a long way and optimism is perfectly normal at this stage of the rally. Despite the frothy sentiment, strong internals continue to support our view that stocks could go higher from current levels. The backdrop of an improving economy, massive levels of fiscal and monetary stimulus, and rising vaccination rates provide further support to this view. While we upgraded our forecast for the global economy and U.S. corporate earnings earlier this month, for now we are maintaining our fair value target range for the S&P 500 of 4,050–4,100. At the same time, we acknowledge the environment appears supportive for stocks to do better, and we continue to recommend an overweight-to-equities and underweight-to-fixed-income position relative to investors’ targets, as appropriate.
Read previous editions of Weekly Market Commentary on lpl.com at News & Media.
IMPORTANT DISCLOSURES
This material is for general information only and is not intended to provide specific advice or recommendations for any individual. There is no assurance that the views or strategies discussed are suitable for all investors or will yield positive outcomes. Investing involves risks including possible loss of principal. Any economic forecasts set forth may not develop as predicted and are subject to change.
References to markets, asset classes, and sectors are generally regarding the corresponding market index. Indexes are unmanaged statistical composites and cannot be invested into directly. Index performance is not indicative of the performance of any investment and do not reflect fees, expenses, or sales charges. All performance referenced is historical and is no guarantee of future results.
Any company names noted herein are for educational purposes only and not an indication of trading intent or a solicitation of their products or services. LPL Financial doesn’t provide research on individual equities.
All information is believed to be from reliable sources; however, LPL Financial makes no representation as to its completeness or accuracy.
US Treasuries may be considered “safe haven” investments but do carry some degree of risk including interest rate, credit, and market risk. Bonds are subject to market and interest rate risk if sold prior to maturity. Bond values will decline as interest rates rise and bonds are subject to availability and change in price.
The Standard & Poor’s 500 Index (S&P500) is a capitalization-weighted index of 500 stocks designed to measure performance of the broad domestic economy through changes in the aggregate market value of 500 stocks representing all major industries.
The PE ratio (price-to-earnings ratio) is a measure of the price paid for a share relative to the annual net income or profit earned by the firm per share. It is a financial ratio used for valuation: a higher PE ratio means that investors are paying more for each unit of net income, so the stock is more expensive compared to one with lower PE ratio.
Earnings per share (EPS) is the portion of a company’s profit allocated to each outstanding share of common stock. EPS serves as an indicator of a company’s profitability. Earnings per share is generally considered to be the single most important variable in determining a share’s price. It is also a major component used to calculate the price-to-earnings valuation ratio.
All index data from FactSet.
Please read the full Outlook 2021: Powering Forward publication for additional description and disclosure.
This research material has been prepared by LPL Financial LLC.
Securities and advisory services offered through LPL Financial (LPL), a registered investment advisor and broker-dealer (member FINRA/SIPC). Insurance products are offered through LPL or its licensed affiliates. To the extent you are receiving investment advice from a separately registered independent investment advisor that is not an LPL affiliate, please note LPL makes no representation with respect to such entity.
| Not Insured by FDIC/NCUA or Any Other Government Agency | Not Bank/Credit Union Guaranteed | Not Bank/Credit Union Deposits or Obligations | May Lose Value |
RES-705650-0421 | For Public Use | Tracking # 1-05134795 (Exp. 04/22)