
U.S. Debt Hits $40 Trillion – What It Means for Investors
Lawrence Gillum | Chief Fixed Income Strategist
Last Updated: August 26, 2026
Additional content provided by Kent Cullinane, CFA, Sr. Analyst, Research.
U.S. government debt recently surpassed $40 trillion for the first time in history, a significant psychological milestone that caught the attention of investors, economists, and policymakers alike. While $40 trillion is a staggering number, focusing solely on the headlines can be misleading. Understanding how we arrived at this level, why debt continues to grow, and what it may mean for the economy, markets, and investment portfolios can provide valuable context and potentially alleviate investor jitters.
How Did We Get Here?
Debt has been used as a funding source for U.S. government programs going back to 1790 and is used in conjunction with government revenue (primarily taxes), to fund different government initiatives. The difference between government revenue and debt results in either a fiscal surplus (more revenue than debt) or a fiscal deficit (more debt than revenue), and the U.S. has run a fiscal deficit the last 25 years consecutively. As a result of these recurring deficits, the national debt has compounded, leading to the $40 trillion in debt today, having doubled over the last decade. Additionally, the rise in interest rates starting in 2022 has led to higher interest payments on the outstanding debt — further intensifying the deficit.
Over the last 25 years, there were several geopolitical and economic events that led to periods of increased debt issuance — the War on Terror, the Great Recession, and the COVID-19 pandemic. Debt was issued to fund a range of initiatives, heavy defense spending, tax cuts, increased government spending, and stimulus programs, while widespread unemployment during a number of these periods decreased tax revenue.
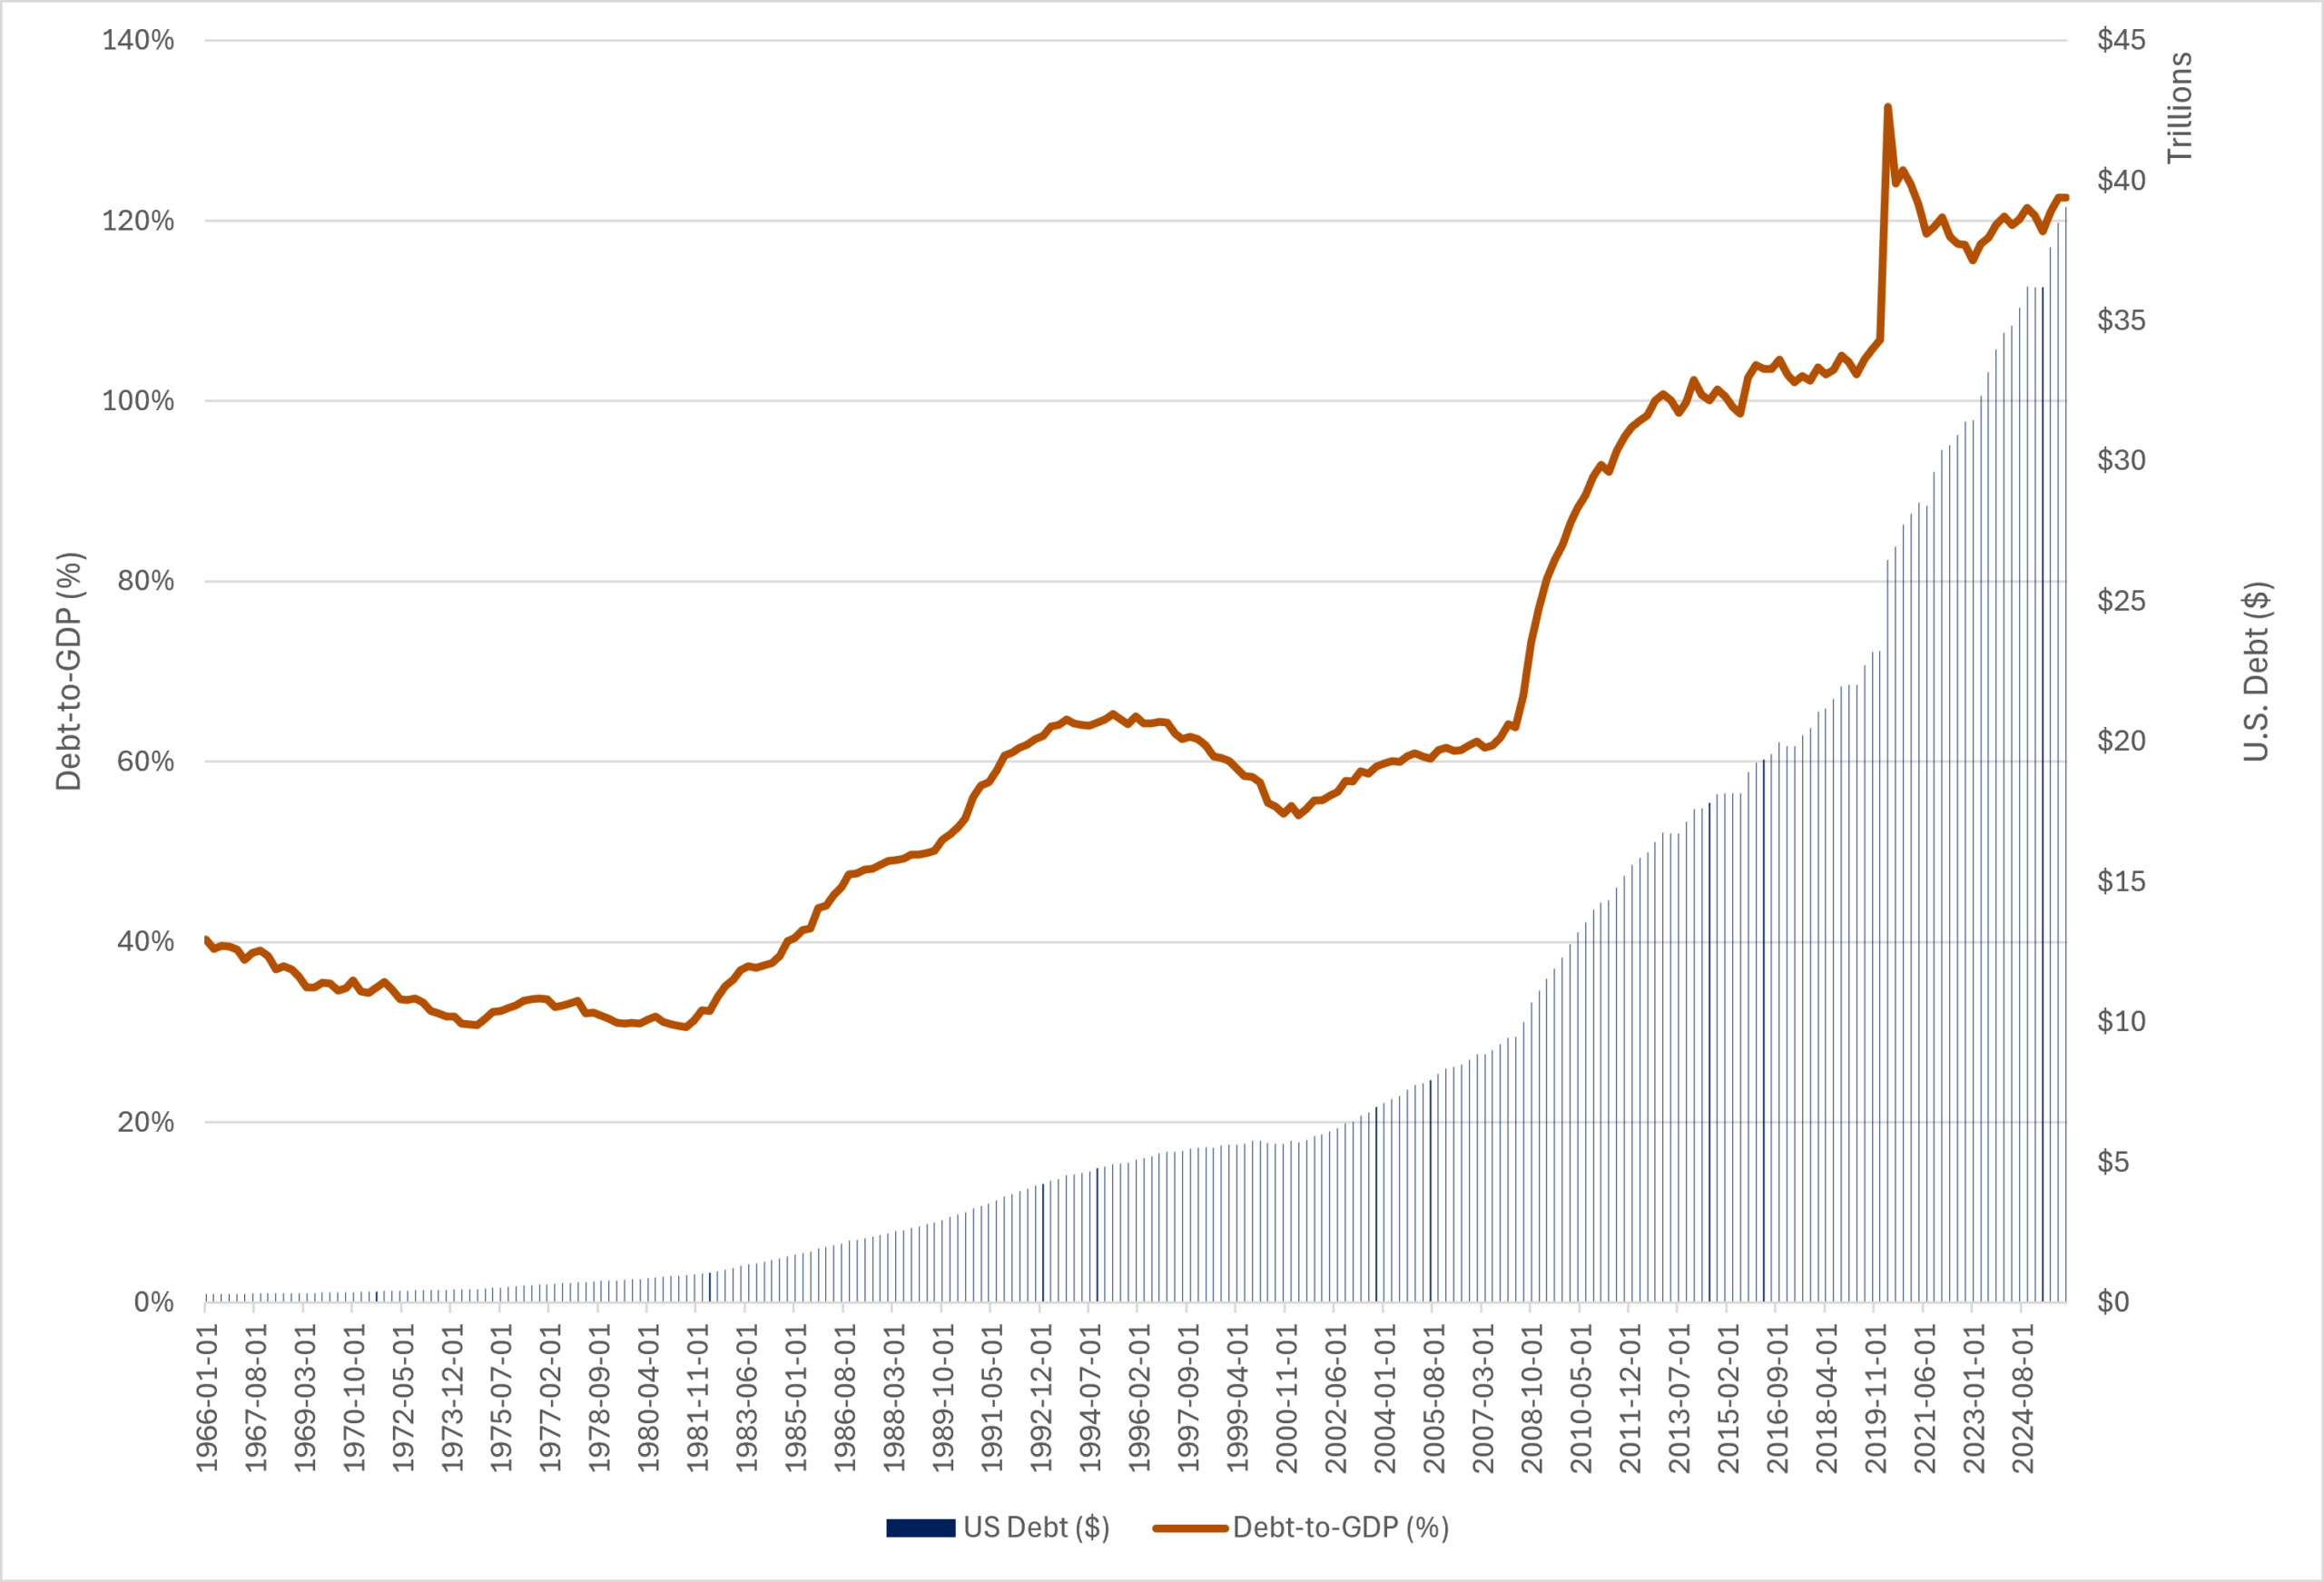
While the $40 trillion debt figure captures headlines, many economists and investors pay closer attention to the debt-to-GDP (gross domestic product) ratio, which measures the nation’s debt relative to its economic output. At roughly 123%, the ratio is near all-time highs. As noted in the “Debt-to-GDP (%) Ratio Ticking Higher” chart, the most pronounced increases occurred during the Great Recession and the COVID-19 pandemic, where government intervention supported the economy in downturns. Although the ratio has moderated from its 2020 peak, it has recently drifted upward as ongoing fiscal deficits, higher borrowing costs, persistent inflation pressures, and new spending programs have outpaced economic growth. Moreover, the fiscal deficits are expected to remain elevated with seemingly little appetite from Washington to act.
Debt-to-GDP (%) Ratio Ticking Higher
Source: LPL Research, FRED 08/24/26
Disclosures: Past performance is no guarantee of future results.
How Are Markets Reacting?
Bond markets, particularly at the long end of the Treasury yield curve, have come under pressure in recent weeks. The 10-year Treasury yield climbed to its highest level since 2023 at approximately 4.7%, while the 30-year Treasury bond yield surpassed 5.3%, its highest level since 2007. Investors appear to be demanding greater compensation for holding long-term government debt amid concerns about the growing volume of Treasury issuance needed to finance persistent fiscal deficits. Elevated inflation, ongoing geopolitical tensions in the Middle East, and significant capital spending tied to the artificial intelligence (AI) boom have further contributed to upward pressure on yields and increased the term premium investors require to lend for longer periods.
Recent Developments
Last Wednesday, the U.S. Treasury announced it would “at least” double its buyback ceiling on longer-dated bonds from $2 billion to $4 billion following the historic rise in yields, as demand for longer maturity bonds has waned. While rates initially fell on the news, yields reverted to pre-announcement levels the following day, as investors viewed the move as a debt reshuffling — refinancing long-term debt with short-term debt, rearranging the maturity profile, but not retiring the older, longer-dated bonds.
The potential $4 billion buyback on a $40 trillion debt pile (amounting to one basis point relative to total debt) did not move the needle enough for investors to move back into long bonds as the underlying fiscal and supply pressures that propped up yields did not disappear.
How to Position Portfolios
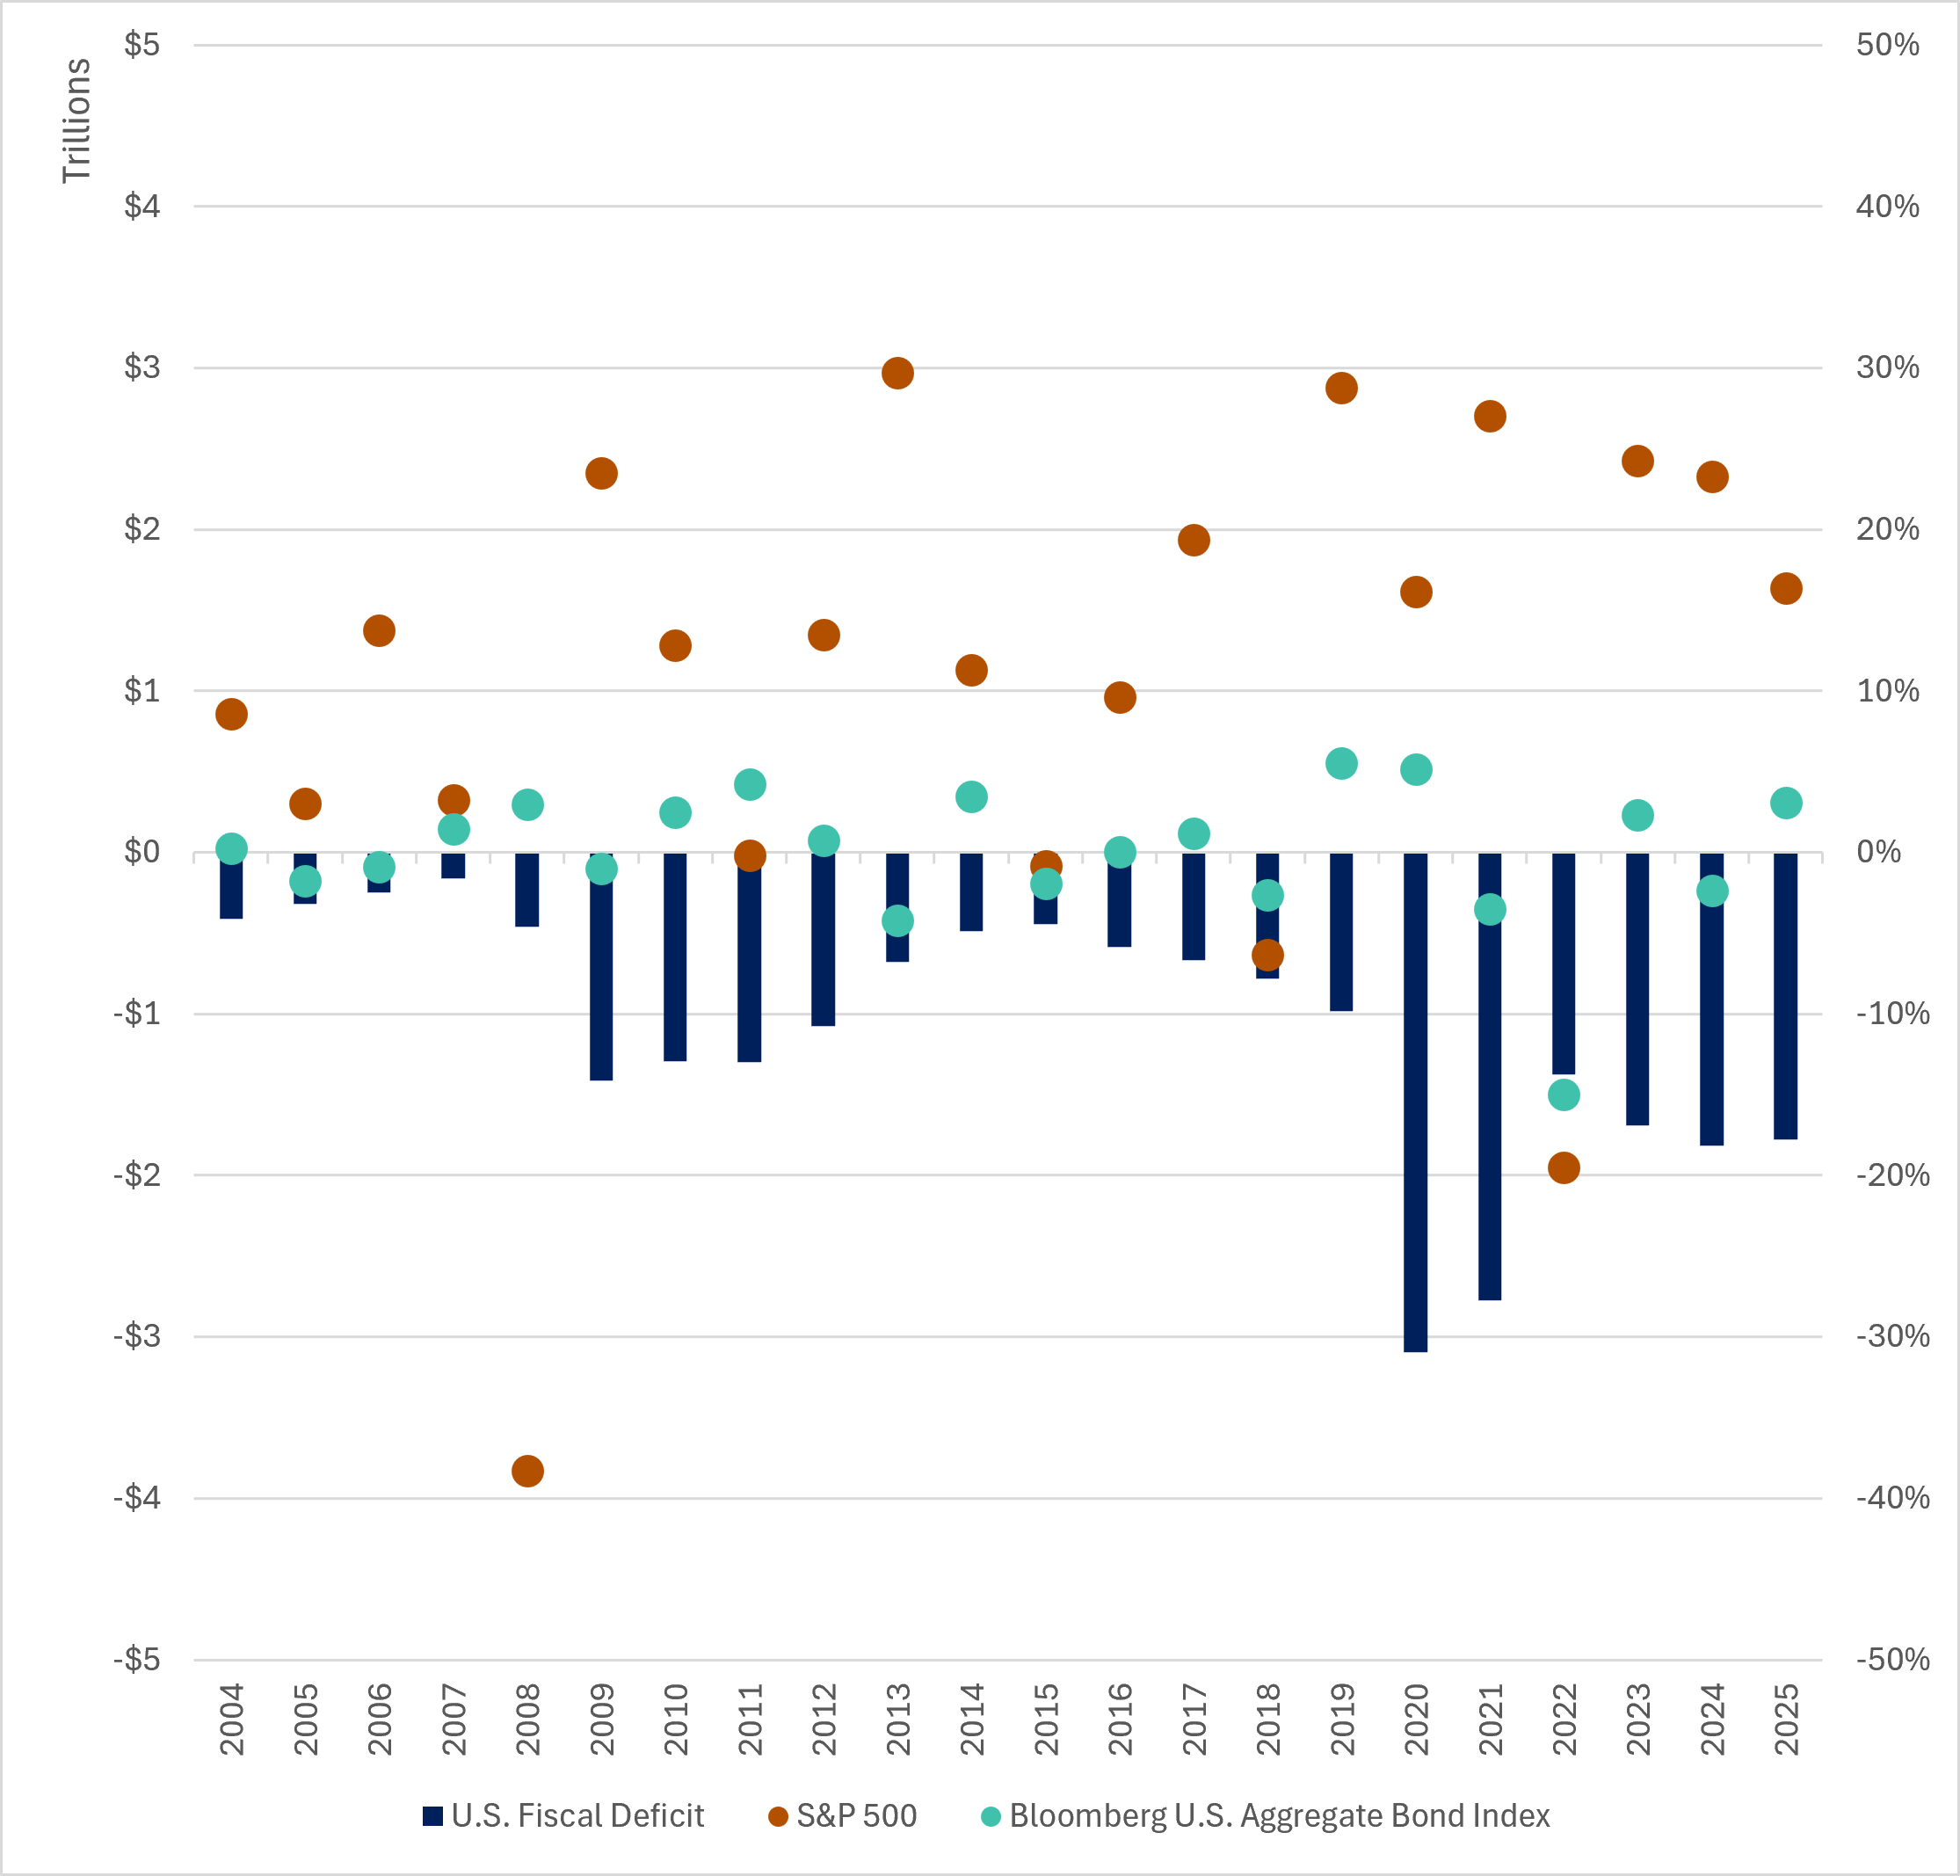
The U.S. government debt and widening deficit have been scrutinized by investors for years, and while it may introduce short-term market volatility, traditional portfolio building blocks like stocks and bonds have generated positive returns despite the headline concerns. According to the “Stocks and Bonds Have Fared Well Despite Widening Deficit” chart, over the last 22 years has shown that in periods where the deficit increases year-over-year, both asset classes have generally risen.
Stocks and Bonds Have Fared Well Despite Widening Deficit
Source: LPL Research, FactSet, FRED 08/24/26
Disclosures: Indexes are unmanaged and cannot be invested in directly. Past performance is no guarantee of future results.
Stocks, as measured by the S&P 500, have generated a positive return 17 of those years, with 13 years of double-digit returns, while bonds, as measured by the Bloomberg U.S. Aggregate Bond Index, have experienced a positive return in over half of periods, with the worst annual return (outside of 2022’s historic rate-hiking regime) being -4.2%. Additionally, it’s worth noting markets have responded well when the government has meaningfully increased their debt issuance in economic slowdowns, as notable in 2009 (following the Great Recession) and 2020 (COVID-19 stimulus).
And importantly, today’s higher bond yields offer more attractive income opportunities, while equities remain an important source of long-term growth. For most investors, the best response is not to react to the $40 trillion headline, but to remain diversified, rebalance when appropriate, and stay focused on long-term financial goals.
Important Disclosures
This material is for general information only and is not intended to provide specific advice or recommendations for any individual. There is no assurance that the views or strategies discussed are suitable for all investors. To determine which investment(s) may be appropriate for you, please consult your financial professional prior to investing.
Investing involves risks including possible loss of principal. No investment strategy or risk management technique can guarantee return or eliminate risk.
Indexes are unmanaged and cannot be invested into directly. Index performance is not indicative of the performance of any investment and does not reflect fees, expenses, or sales charges. All performance referenced is historical and is no guarantee of future results.
This material was prepared by LPL Financial, LLC. All information is believed to be from reliable sources; however LPL Financial makes no representation as to its completeness or accuracy.
Unless otherwise stated LPL Financial and the third party persons and firms mentioned are not affiliates of each other and make no representation with respect to each other. Any company names noted herein are for educational purposes only and not an indication of trading intent or a solicitation of their products or services.
Asset Class Disclosures –
International investing involves special risks such as currency fluctuation and political instability and may not be suitable for all investors. These risks are often heightened for investments in emerging markets.
Bonds are subject to market and interest rate risk if sold prior to maturity.
Municipal bonds are subject and market and interest rate risk and potentially capital gains tax if sold prior to maturity. Interest income may be subject to the alternative minimum tax. Municipal bonds are federally tax-free but other state and local taxes may apply.
Preferred stock dividends are paid at the discretion of the issuing company. Preferred stocks are subject to interest rate and credit risk. They may be subject to a call features.
Alternative investments may not be suitable for all investors and involve special risks such as leveraging the investment, potential adverse market forces, regulatory changes and potentially illiquidity. The strategies employed in the management of alternative investments may accelerate the velocity of potential losses.
Mortgage backed securities are subject to credit, default, prepayment, extension, market and interest rate risk.
High yield/junk bonds (grade BB or below) are below investment grade securities, and are subject to higher interest rate, credit, and liquidity risks than those graded BBB and above. They generally should be part of a diversified portfolio for sophisticated investors.
Precious metal investing involves greater fluctuation and potential for losses.
The fast price swings of commodities will result in significant volatility in an investor’s holdings.
This research material has been prepared by LPL Financial LLC.
Not Insured by FDIC/NCUA or Any Other Government Agency | Not Bank/Credit Union Deposits or Obligations | Not Bank/Credit Union Guaranteed | May Lose Value
For Public Use – Tracking: #1165104