Last week was a huge news week, from the Fed, to gross domestic product (GDP), to a giant week of earnings reports. Below we review the big events from last week, while also looking ahead to what could be an eventful August for investors.
Earnings Continue To Soar
Last week was a very busy week for quarterly earnings reports and as we wrote in Midyear Outlook 2021: Picking Up Speed, we expected strong earnings growth to support further gains for stocks in the second half of 2021. Well, the second half is only a month old, but corporate America has sure delivered so far this earnings season. With only about half of S&P 500 Index constituents having reported so far, earnings growth is tracking to a year-over-year increase of 85% (source: FactSet), more than 20 percentage points above the consensus expectation when earnings season began and well ahead of our optimistic upside target in the mid-to-high-70s. We thought the bar had been raised too high for that much upside. Clearly we were wrong.
Growing earnings from the depressed year-ago quarter while much of the economy was shut down is not very impressive on its own. But blowing away analysts’ estimates after they’ve been consistently raised since last fall is very impressive, especially when considering ongoing challenges around COVID-19, supply chain bottlenecks, labor and materials shortages, and input cost pressures.
The strong momentum doesn’t appear ready to stop anytime soon. Estimates have been rising as companies have shared their outlooks. The consensus estimate for 2022 has increased 1.7 percentage points since July 1, a strong result given the history of estimate reductions during reporting season and the fact that about half of the index has yet to report.
Latest From The Fed
Last week the July Federal Open Market Committee (FOMC) meeting provided no real surprises and no changes were made to current interest rate or bond purchasing policies. The Fed did acknowledge that the economy has made progress toward meeting employment and inflation goals; so, we’re getting closer to an official tapering announcement likely coming in the next few months. Chairman Jerome Powell said that the FOMC discussed the pace and composition of tapering but did not make any final decisions. He indicated that there is “little support” for tapering mortgage-backed securities (MBS) purchases first.
The FOMC doesn’t formally meet again until September 21, but we may get additional details on the eventual removal of monetary accommodation at the Jackson Hole, WY, Economic Symposium which begins August 26. Additionally, the meeting minutes from the July FOMC meeting will be released on August 18, so we’re likely to get further details around the Fed’s plans to reduce its bond purchases at that time. Given the varying viewpoints within the Committee on tapering, the next meeting minutes could be market moving.
Big GDP Growth, But Still Misses
The other big event last week was second quarter GDP. The U.S. economy grew at a 6.5% annualized pace, well below the 8.5% that was expected, but still above the first quarter’s 6.3% pace according to the Bureau of Economic Analysis’ (BEA) preliminary estimate of real GDP. The composition of the growth largely reinforced the prevailing narratives of a strong consumer juxtaposed with supply chain bottlenecks, restricting growth.
Consumer spending, as is typical, represented the dominant growth contributor, surging in the second quarter in part due to government transfer payments. Crucially, though, spending on services, which is largely in-person, bounced strongly, signaling an increased confidence among consumers to venture out. Business fixed investment came in strong and demonstrated businesses’ attempts to ramp up output to meet surging demand. Residential investment had a more predictable decline, as well-documented labor shortages and high materials costs are restricting new projects. The volatile inventory components, though, did represent a drag, but may reverse and provide a boost to growth in coming quarters.
Looking forward, we expect continued growth in the third quarter but with a different composition. Consumer spending should still be respectable, but likely will recede a bit due to the fading impact of past government transfer payments and less impetus from the reopening. Business investment should continue to recover, though, and net exports may improve as the rest of the world plays catch-up to the U.S. in their recoveries, consuming more of our goods and services.
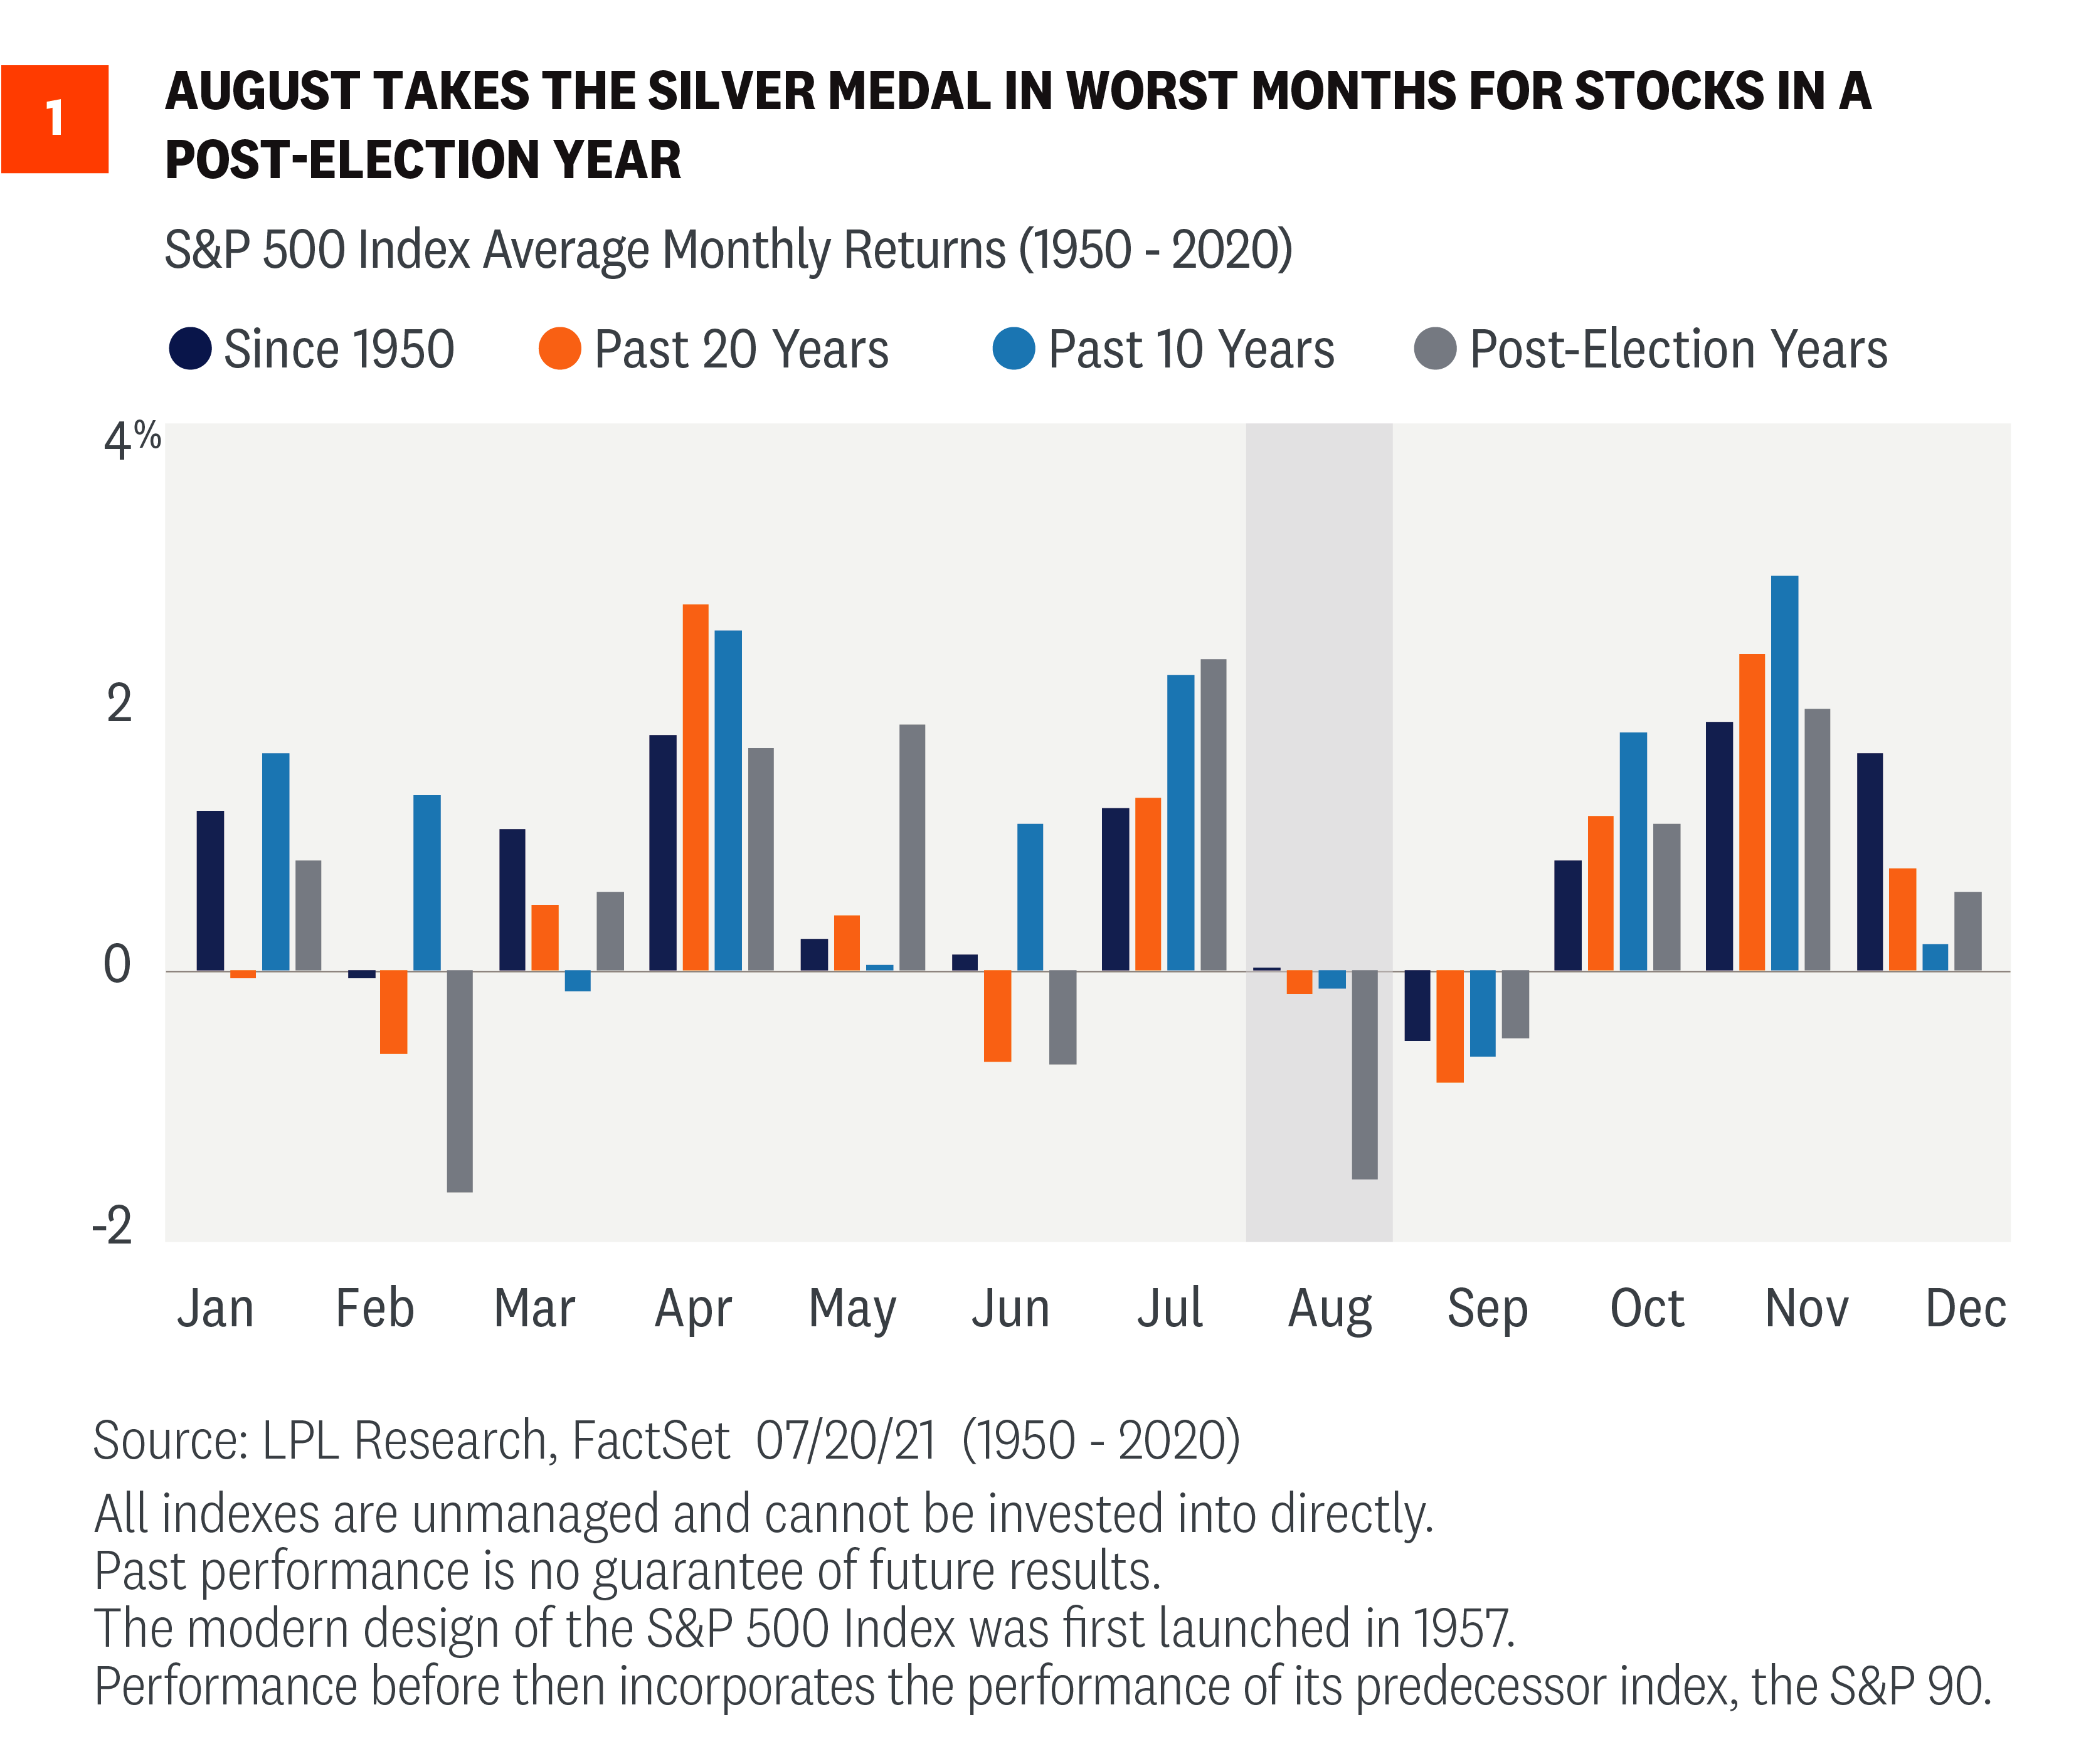
August Could Be Rough
At the start of the month we noted that July is the best month of the year for stocks in a post-election year; well, the bad news is August is quite weak in a post-election year. As Figure 1 shows, the S&P 500 Index is down 1.4% on average in post-election years, with only February worse. Taking things a step further, when August is lower, it can be really lower. In fact, since 1950, when August is negative it is down 3.9% on average, making it the worst month of the year when it is lower.
Considering stocks are up six months in a row, the chances that a well-deserved pullback could happen are only increasing. Besides August’s weak historical performance, investors need to be aware that September is the worst month on average since 1950. Even more recently stocks have struggled during these two months, as they are the only two months with a negative average return over the past 10- and 20-year periods. That being said, we believe the magnitude of a pullback could be limited by a solid economic backdrop, strong earnings momentum, corporate buyback activity, and attractive valuations for stocks relative to cash and high-quality bonds. We’ve also seen the 50-day moving average consistently provide support for stocks so far this year, and that level is currently just 3% below where the S&P 500 Index is trading at this time.
China Regulations Heat Up
China’s stock market has been hit hard in response to several sudden regulatory actions that have concerned investors. First came the crackdown on ride sharing service DiDi, which has about a 90% market share in China. Regulators had announced a cybersecurity review soon after its initial public offering on the New York Stock Exchange (NYSE), eventually ordering the removal of DiDi from app stores. Then there were fines against tech giants Alibaba and Tencent. Next came an announcement that for-profit tutoring services would no longer be able to charge for certain core classes. The rapid sequence of government action against publicly traded companies has shaken market participants. Hong Kong’s Hang Seng Index sold off nearly 15% in about a month.
China has been seeking increased access to international capital markets for decades, but free market mechanisms are not sitting well with an increasingly authoritarian style of government. Chinese officials have more recently taken a more conciliatory tone to try to settle markets back down, but broken trust is not easily restored. Recent price declines may bring opportunities and China’s economy continues to thrive, but we don’t believe the added uncertainty from possible government interference has yet been fully priced in. How things play out in August may set the tone for the rest of the year.
Conclusion
Market moving events happen all the time, but last week was one of the largest of the year. With stocks still flirting with all-time highs, the bar could be set quite high and any disappointment could lead to a pullback or correction. However, we continue to believe the earnings being generated by U.S. companies are strong enough to justify current valuations, and that stocks may add to strong year-to-date returns over the next five months even with a potential increase in volatility that tends to occur during the second year of bull markets. We continue to recommend a modest overweight allocation to stocks relative to bonds.
As we head into the historically volatile months of August – October, investors need to be ready for some potential big moves. Could it be the Fed, inflation, China, or something else that causes the volatility? Stay tuned, but we’ll be here to explain it whatever it is.
Click here to download a PDF of this report.
IMPORTANT DISCLOSURES
This material is for general information only and is not intended to provide specific advice or recommendations for any individual. There is no assurance that the views or strategies discussed are suitable for all investors or will yield positive outcomes. Investing involves risks including possible loss of principal. Any economic forecasts set forth may not develop as predicted and are subject to change.
References to markets, asset classes, and sectors are generally regarding the corresponding market index. Indexes are unmanaged statistical composites and cannot be invested into directly. Index performance is not indicative of the performance of any investment and do not reflect fees, expenses, or sales charges. All performance referenced is historical and is no guarantee of future results.
Any company names noted herein are for educational purposes only and not an indication of trading intent or a solicitation of their products or services. LPL Financial doesn’t provide research on individual equities.
All information is believed to be from reliable sources; however, LPL Financial makes no representation as to its completeness or accuracy.
US Treasuries may be considered “safe haven” investments but do carry some degree of risk including interest rate, credit, and market risk. Bonds are subject to market and interest rate risk if sold prior to maturity. Bond values will decline as interest rates rise and bonds are subject to availability and change in price.
The Standard & Poor’s 500 Index (S&P500) is a capitalization-weighted index of 500 stocks designed to measure performance of the broad domestic economy through changes in the aggregate market value of 500 stocks representing all major industries.
The PE ratio (price-to-earnings ratio) is a measure of the price paid for a share relative to the annual net income or profit earned by the firm per share. It is a financial ratio used for valuation: a higher PE ratio means that investors are paying more for each unit of net income, so the stock is more expensive compared to one with lower PE ratio.
Earnings per share (EPS) is the portion of a company’s profit allocated to each outstanding share of common stock. EPS serves as an indicator of a company’s profitability. Earnings per share is generally considered to be the single most important variable in determining a share’s price. It is also a major component used to calculate the price-to-earnings valuation ratio.
All index data from FactSet.
Please read the full Midyear Outlook 2021: Picking Up Speed publication for additional description and disclosure.
This research material has been prepared by LPL Financial LLC.
Securities and advisory services offered through LPL Financial (LPL), a registered investment advisor and broker-dealer (member FINRA/SIPC). Insurance products are offered through LPL or its licensed affiliates. To the extent you are receiving investment advice from a separately registered independent investment advisor that is not an LPL affiliate, please note LPL makes no representation with respect to such entity.
Not Insured by FDIC/NCUA or Any Other Government Agency | Not Bank/Credit Union Guaranteed | Not Bank/Credit Union Deposits or Obligations | May Lose Value
RES-844300-0721 | For Public Use | Tracking # 1-05173990 (Exp. 07/22)