After a brief lull in 2023, buyback activity appears to be back this year. A resilient U.S. economy, easing inflation pressures, and expectations for an eventual shift to interest rate cuts have given corporate America confidence to boost authorized share repurchases. These companies have a history of outperforming the broader market and tend to have more exposure to momentum, value, and growth factors. While buybacks also reduce share count and help support earnings growth and valuations, they can also help limit downside volatility during periods of selling pressure.
Buyback Backdrop
Buybacks, also referred to as share repurchases, are when a company elects to purchase its own shares in the open market. They are typically announced as a ‘share repurchase authorization’ and are bound by a maximum dollar amount or share amount the company can repurchase. And while most share repurchase programs are executed, they don’t necessarily have to be, as management maintains discretion over when or if the company buys back its shares.
Buyback activity has made a comeback after most companies suspended share repurchase programs in the wake of the pandemic. For example, total S&P 500 buybacks jumped from $525 billion in 2020 to $930 billion in 2022. However, buybacks tapered off last year to $782 billion as economic uncertainty and higher interest rates pushed repurchases to the sidelines. (Higher rates made leveraged buybacks — when companies issue debt to buy back shares — less attractive.)
With the economy continuing to show signs of resilience and inflation moving in the right direction, albeit at a slower and bumpier trajectory than expected, buybacks are expected to rebound again in 2024. According to S&P Dow Jones Indices, S&P 500 companies are expected to repurchase $885 billion in stock this year. So far, companies are off to a solid start with $155 billion in announced repurchases year to date, including a notable $50 billion share repurchase program from Meta (META).
While there is a lot of debate over the utilization and value of share buyback programs (which we are not going to delve into here), the market has typically rewarded companies that buy back stock. This year, the S&P 500 Buyback Index is up 3.5% as of February 22 and is back in record high territory after surpassing its 2022 highs. Both trend and momentum indicators suggest this rally has more room to run. For reference, the S&P 500 Buyback Index represents an equally weighted and quarterly rebalanced basket of the top 100 stocks with the highest buyback ratio (cash paid for common shares during the last four calendar quarters divided by the total market capitalization of common shares).
S&P 500 Buyback Index reaches Record-High Territory
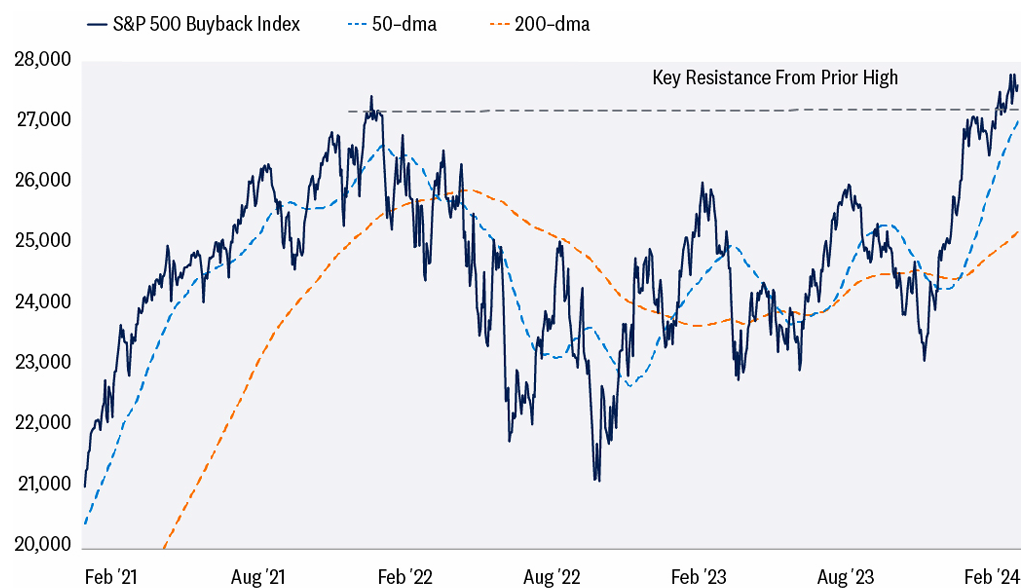
Source: LPL Research, Bloomberg 02/22/24
Past performance is no guarantee of future results. All indexes are unmanaged and can’t be invested in directly.
Buybacks Historically Outperform
While the S&P 500 Buyback Index is underperforming the broader S&P 500 by about 3% year to date, history suggests it could have some catching up to do. Over the last 20 years, the S&P 500 Buyback Index has beaten the S&P 500 71% of the time, amassing an average annual return of 11%. This compares to the S&P 500’s average annual return of 8.9% over the same period.
The S&P 500 Buyback Index Has Historically Outperformed The S&P 500
S&P 500 Buyback Index vs. S&P 500
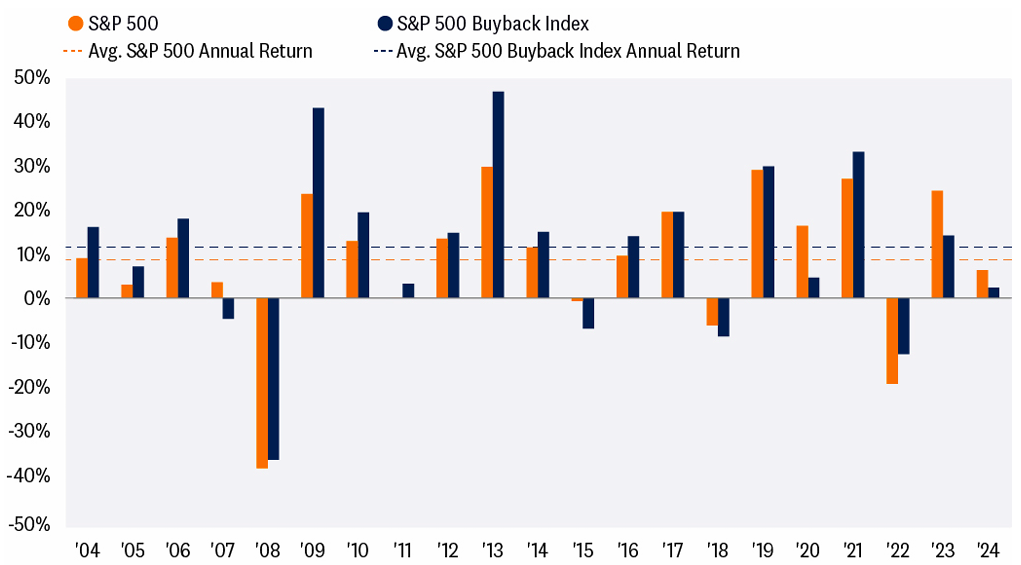
Source: LPL Research, Bloomberg 02/22/24
Past performance is no guarantee of future results. All indexes are unmanaged and can’t be invested in directly.
A Closer Look Under The Hood
As noted in the S&P 500 Buyback Index vs. S&P 500 chart, companies with high buyback ratios have historically performed quite well. However, it is not just share repurchases that drive outperformance, as many of these companies have more unique fundamental factors that can separate them from non-buyback companies. This chart highlights these fundamental tilts on more of an equal playing field by comparing factor exposure between the S&P 500 Buyback Index to an Equal Weight S&P 500 ex Buyback Index (excludes the companies in the buyback index). When the exposure score is positive, it implies the S&P 500 Buyback Index has more exposure to the factors listed below. For example, the S&P 500 Buyback Index has much more exposure to value, momentum, and growth relative to the S&P 500 ex Buyback Index. Among those factors, buyback companies stick out compared to non-buyback companies with typically higher earnings yield, earnings and sales growth, and profitability.
Buyback Stocks Are Tilted Toward Value, Momentum, and Growth
S&P Buyback Index Factor Tilts vs. S&P 500 ex Buyback Index
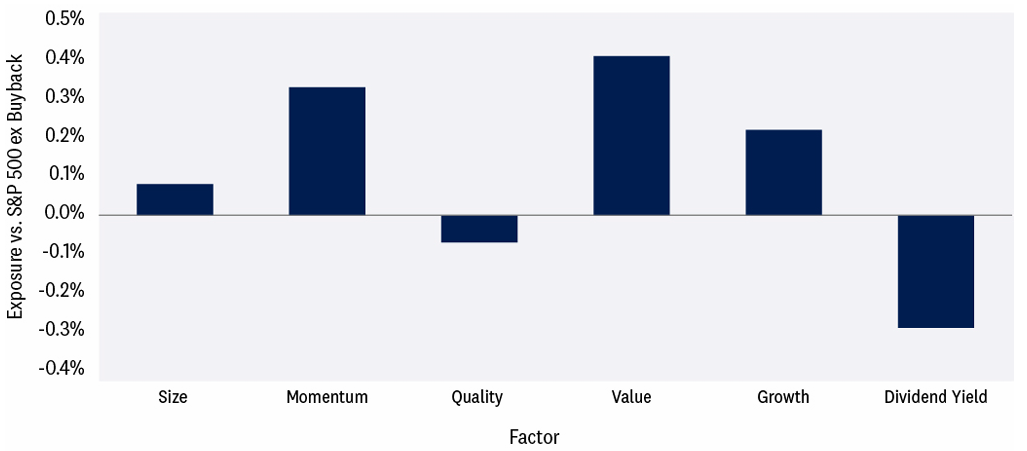
Source: LPL Research, Bloomberg 02/22/24
Past performance is no guarantee of future results. All indexes are unmanaged and can’t be invested in directly.
What About The Magnificent Seven
It is nearly impossible to have any market-related discussion without mentioning the Magnificent Seven, comprised of Alphabet (GOOG/L), Amazon (AMZN), Apple (AAPL), Meta (META), Microsoft (MSFT), NVIDIA (NVDA), and Tesla (TSLA). While these mega-caps have contributed to the majority of the S&P 500’s year-to-date gain and are solely responsible for lifting the index’s fourth quarter earnings into positive territory, most also have sizable buyback programs in place to support their stock. As illustrated in the “Magnificent Seven Buyback” chart, total buybacks for the group in 2023 totaled just over $195 billion, with AAPL and GOOG/L representing the lion’s share. Looking ahead to 2024, it could be another sizable year of share repurchases as the group still has $149 billion penciled in for buybacks.
Most Mega Cap Stocks Have More Buying To Do
Magnificent Seven Buybacks
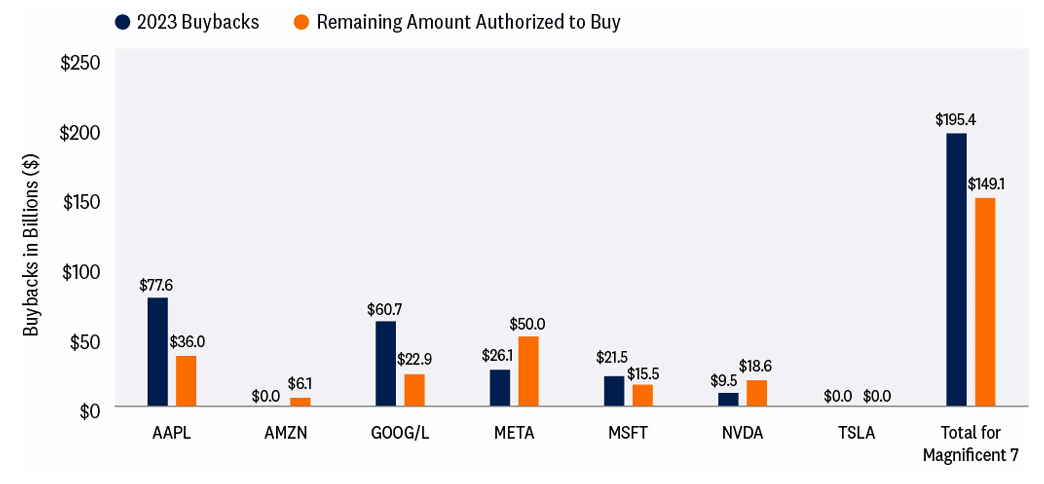
Source: LPL Research, Bloomberg 02/22/24
Past performance is no guarantee of future results. All indexes are unmanaged and can’t be invested in directly.
Any companies referenced are being presented as a proxy, not as a recommendation.
Conclusion
This year, buyback activity appears to be back in action as inflationary pressures subside and the Federal Reserve (Fed) gets closer to transitioning from rate hikes to rate cuts. Economic activity and earnings are also improving. While Treasury yields have recently moved higher due to the repricing of Fed rate cuts further out on the calendar, higher rates have not eroded confidence in the potential for a soft-landing scenario. This backdrop, coupled with what LPL Research believes is limited upside risk to rates, has renewed confidence in corporate America to roll out sizable buyback programs. While buybacks reduce share count and help support earnings growth and valuations, they can also help limit downside volatility in the event of selling pressure.
Asset Allocation Insights
LPL’s Strategic and Tactical Asset Allocation Committee (STAAC) maintains its neutral equities stance despite the strength of the latest stock market rally that has carried the S&P 500 over the 5,000 milestone. The improved outlook for economic growth and earnings, along with relative stability in interest rates, keeps the risk-reward trade-off for stocks and bonds fairly well balanced, though upside over the balance of the year is likely to be fairly modest.
Within equities, the STAAC continues to favor a tilt toward domestic over international equities, with a preference for Japan among developed markets, and an underweight position in emerging markets (EM). The Committee also recommends a slight tilt toward large caps and growth stocks. Finally, the STAAC continues to recommend a modest overweight to fixed income, funded from cash.
IMPORTANT DISCLOSURES
This material is for general information only and is not intended to provide specific advice or recommendations for any individual. There is no assurance that the views or strategies discussed are suitable for all investors or will yield positive outcomes. Investing involves risks including possible loss of principal. Any economic forecasts set forth may not develop as predicted and are subject to change.
References to markets, asset classes, and sectors are generally regarding the corresponding market index. Indexes are unmanaged statistical composites and cannot be invested into directly. Index performance is not indicative of the performance of any investment and do not reflect fees, expenses, or sales charges. All performance referenced is historical and is no guarantee of future results.
Any company names noted herein are for educational purposes only and not an indication of trading intent or a solicitation of their products or services. LPL Financial doesn’t provide research on individual equities.
All information is believed to be from reliable sources; however, LPL Financial makes no representation as to its completeness or accuracy.
US Treasuries may be considered “safe haven” investments but do carry some degree of risk including interest rate, credit, and market risk. Bonds are subject to market and interest rate risk if sold prior to maturity. Bond values will decline as interest rates rise and bonds are subject to availability and change in price.
The Standard & Poor’s 500 Index (S&P500) is a capitalization-weighted index of 500 stocks designed to measure performance of the broad domestic economy through changes in the aggregate market value of 500 stocks representing all major industries.
The PE ratio (price-to-earnings ratio) is a measure of the price paid for a share relative to the annual net income or profit earned by the firm per share. It is a financial ratio used for valuation: a higher PE ratio means that investors are paying more for each unit of net income, so the stock is more expensive compared to one with lower PE ratio.
Earnings per share (EPS) is the portion of a company’s profit allocated to each outstanding share of common stock. EPS serves as an indicator of a company’s profitability. Earnings per share is generally considered to be the single most important variable in determining a share’s price. It is also a major component used to calculate the price-to-earnings valuation ratio.
All index data from FactSet.
Value investments can perform differently from the market as a whole. They can remain undervalued by the market for long periods of time.
The prices of small cap stocks are generally more volatile than large cap stocks.
International investing involves special risks such as currency fluctuation and political instability and may not be suitable for all investors. These risks are often heightened for investments in emerging markets.
LPL Financial does not provide investment banking services and does not engage in initial public offerings or merger and acquisition activities.
This research material has been prepared by LPL Financial LLC.
Securities and advisory services offered through LPL Financial (LPL), a registered investment advisor and broker-dealer (member FINRA/SIPC). Insurance products are offered through LPL or its licensed affiliates. To the extent you are receiving investment advice from a separately registered independent investment advisor that is not an LPL affiliate, please note LPL makes no representation with respect to such entity.
Not Insured by FDIC/NCUA or Any Other Government Agency | Not Bank/Credit Union Deposits or Obligations | Not Bank/Credit Union Guaranteed | May Lose Value
RES-000662-0124 | For Public Use | Tracking #545391 (Exp. 02/2025)
For a list of descriptions of the indexes referenced in this publication, please visit our website at lplresearch.com/definitions.